

Natalie Fedorenko
Web analyst at PROANALYTICS.TEAMMarketing Analytics for E-commerce
This article feels like a natural continuation of the previous one on a similar topic — but I wouldn’t have written it if it weren’t for the feedback on the article Analytics for SaaS. Thank you, dear readers, for your engagement and responses. Your feedback shows us that what we share is genuinely helpful.
Today, let’s dive into the world of analytics and metrics for another popular type of business — E-commerce.
Here’s what we’ll cover:
Disclaimer
This is not meant to be an exhaustive guide on how to build comprehensive analytics for E-commerce. I hope it’s clear that it’s simply impossible to cover everything in a single blog post. Our team will, of course, continue exploring various areas of analytics — for this and other types of businesses. And when we’re done, all these articles combined will likely resemble a large, possibly very large book.
But just like a book is written gradually, building analytics is also a step-by-step process. One general recommendation for everyone: set your priorities, especially at the beginning — identify what is essential to analyze first, and what can wait. For example, choosing between analyzing marketing ROI and evaluating the work of your sales managers is a no-brainer — the latter can wait, as their payroll costs usually pale in comparison to the marketing budget.
Since taking the first step is often the hardest, I’ll try in this article to help you understand where to start and what the “must-have minimum” looks like. Once you’ve built that minimum, it’ll be much easier to identify what’s still missing and which questions remain unanswered.
We’ll explore the key metrics and approaches across two major areas of analytics: investment profitability and customer base analysis. Let’s dive in.
About Profitability
In this section, we’ll talk about the metrics that help us* understand whether our investments in generating revenue are paying off — and which customer acquisition sources are the most profitable, and which need optimization.
*When I think about a client’s analytics, I always imagine myself as part of their team, working toward shared goals. So throughout this article, I’ll often use the pronoun “we” to refer to you, the reader, and your business — because that’s how our team works: we consider ourselves part of the client’s team, not outsiders.
Revenue Metrics
Obviously, the first metric to look at is the total amount of money received from customers for successful orders — in other words, revenue.
In terms of absolute values, it’s also helpful to look at the number of orders and the number of customers who placed them. These figures are best visualized in a chart to identify trends and seasonality.
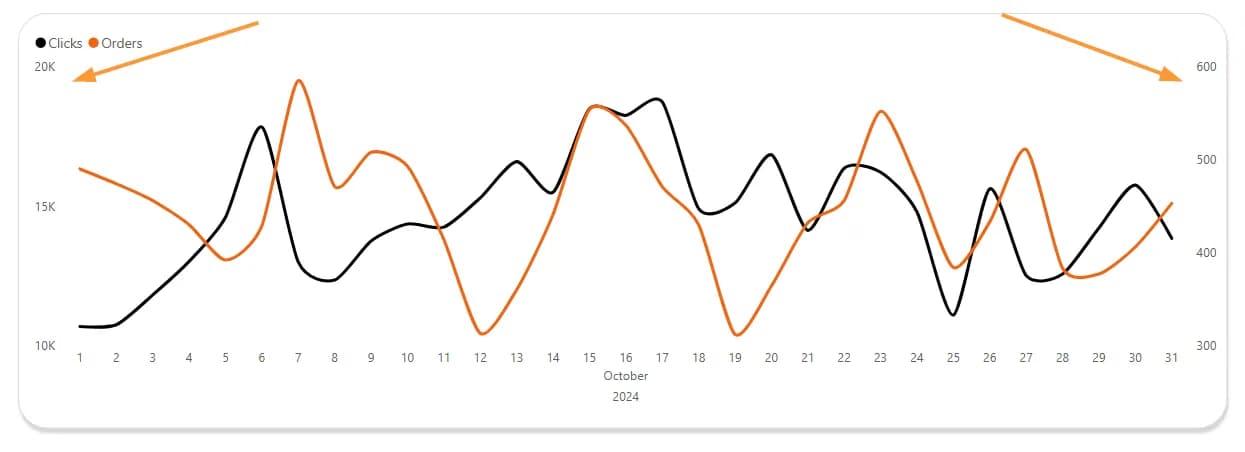
Sometimes it makes sense to combine absolute investment and revenue metrics in a dual Y-axis chart — for example, plotting clicks and orders together. Why “sometimes”? Because such charts are harder to interpret: each metric has its own scale on the Y-axis, which can create the illusion that you're getting more orders than clicks when the lines cross. In reality, the crossover happens simply because the scales differ. Here's an example of such a chart:
Among relative metrics, the following are worth highlighting:
- Percentage of First Orders – This is important to understand whether we are attracting new customers, and how frequently. It’s much harder to acquire a new customer than to retain an existing one who already had a good experience with us. That’s why at this early stage, it’s useful to see how well we’re converting first-time buyers. Retention analysis is better done in other types of reports that allow for deeper insights into how well we keep our customers engaged — we’ll discuss those in the second part of the article. At this point, the percentage of first orders will show how effectively and consistently you’re growing your customer base. Without acquiring new customers, it’s unrealistic to expect stable revenue growth, as your pool of “active” buyers will naturally shrink over time, even if your retention is relatively strong.
- Average Order Value (AOV) – This metric, alongside cost per order (CPO, which we’ll cover later), provides an initial and approximate view of your investment return.
AOV = Revenue / Number of successful orders
Average Revenue Per User (ARPU) – A well-known and commonly used metric, often calculated as the total revenue divided by the number of customers in a selected time period. However, the “selected period” might not include all revenue from customers who ordered during that time — some revenue could have been generated earlier. If we only analyze the selected period and your customers rarely make repeat purchases during it, ARPU will not differ much from AOV. So then, a fair question arises — why use ARPU at all if you already have AOV?
In general, I recommend always asking metrics this type of question: what specific business insight is this number supposed to provide? Metrics shouldn’t exist just for the sake of calculation — they should help you make informed strategic decisions.
Back to ARPU — what happens if we calculate revenue per customer not just for a given period, but over their entire “lifetime” with us?
That “lifetime” could currently be a month, or it could be five years. You might see a number like “5,000” and reasonably ask: “So what?”
If your goal is to determine the maximum amount you can invest in acquiring a new customer without making the business unprofitable, then ARPU — whether for a selected period or for all time — won’t help. For that, you need a different technique: cohort analysis. We’ll cover it in detail in the second section of the article.
For now, here’s the gist: you need to define how long you’re willing to wait before a new customer becomes profitable. Let’s say that’s six months. Cohort analysis will help you determine the acquisition cost per customer in a given month and track cumulative profit from those customers over time. For example, if a cohort of customers acquired in January still hasn’t turned a profit by June, it means you either need to encourage more repeat purchases within those first six months — or reduce the acquisition cost.
In this case, “cumulative customer profit” for a specific month after acquisition could technically be called ARPU — but as you can see, there are plenty of nuances. Your ARPU might be calculated differently, and that’s okay. What matters is that the metric helps you make data-driven decisions.
Investment Metrics
Revenue and investments are two of the three fundamental components required for building marketing performance analytics — commonly known as marketing attribution or full-funnel analytics. Its primary purpose is to show the relationship between revenue and costs, broken down by the third essential component: revenue and cost sources, which we’ll explore in the next section.
This type of reporting helps answer the question: Where exactly are we losing or gaining as a business? I’ve already written a separate article on end-to-end analytics with an interactive report. You’ll find more details there — and get a clear picture of what your own report could look like. I’ll leave the link here.
So, what do we include under investments? Of course, ad platform spend — but that’s not all.
It’s also helpful to view costs together with impressions and clicks. If your spend increases or decreases, combining that with metrics like impressions, clicks, CTR (click-through rate), and CPC (cost per click) will help determine whether the change is due to fluctuations in traffic demand or competitor actions that made traffic more expensive (or cheaper).
If you're investing in SEO, those costs must also be included in your end-to-end analytics. Same for spending on influencer placements, guest posts on external platforms, and similar.
But we’re not done — because you also invest in purchasing or producing the goods you sell. The total amount spent on procuring or producing sold items is called COGS (Cost of Goods Sold). You need to account for this too. The general formula:
COGS = opening inventory + purchases during the period – ending inventory
Alternatively, you can calculate it based on the cost of purchased goods and the quantity sold per order.
Additionally, your business incurs other costs related to selling goods, such as delivery fees, platform commissions, etc. Together with COGS, these make up your Cost of Sales. This figure plays a role in calculating: Gross Profit (we’ll cover that later) and Customer Acquisition Cost — CAC (usually for new customers). CAC formula:
CAC = (COGS + marketing spend) / number of new customers
However, there are nuances. A business might choose to calculate the cost of acquiring any customer — including returning ones. The benefit of this approach is that it measures the impact of campaigns aimed at repeat purchases. In this case, the formula's denominator would include all customers who made a purchase during the selected period. The downside? This approach understates the cost of acquiring a new customer, since part of the spend is “shared” with those already acquired — who just needed a nudge to order again.
Another relative investment metric to consider is CPO (Cost per Order):
CPO = (COGS + marketing spend) / number of successful orders
Often, CAC and CPO are calculated using only marketing spend, excluding COGS. But that’s a mistake. Omitting COGS means you’re missing a large part of the true investment required to acquire a customer or generate an order — so for meaningful end-to-end analytics, COGS must be included.
On top of that, your business also has operational and non-operational expenses — in simple terms, costs not included in COGS, like rent, utilities, salaries, maintenance, taxes, etc. These are used to calculate Net Profit, which we’ll discuss soon.
Revenue Sources
We invest in channels that bring in buyers and revenue. Most businesses know exactly where they’re spending money — but understanding the sources of revenue can be much trickier. And yet, for any company that uses the internet to attract customers, knowing where your sales come from is one of the most important aspects of marketing analytics.
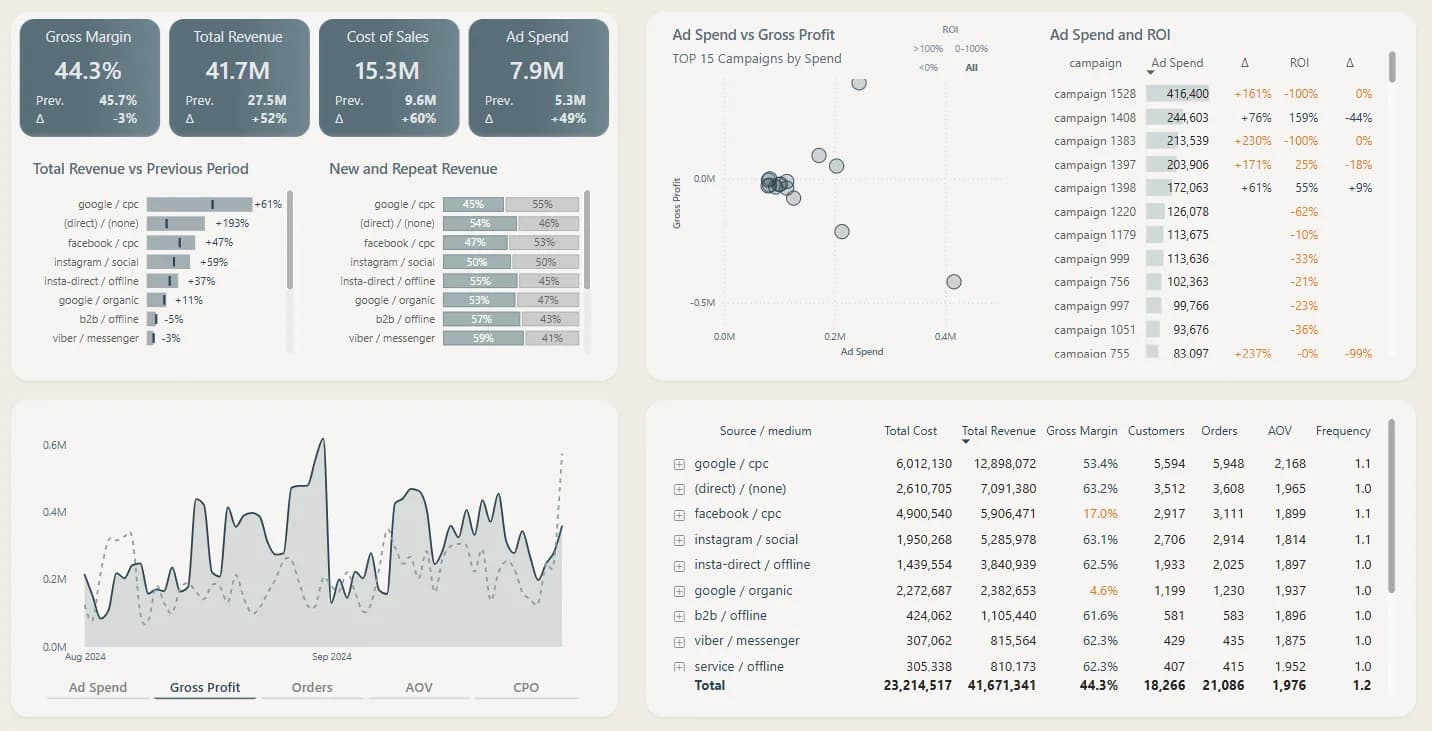
Rather than explaining why it's worth investing time and effort here, let me just show you an example of what a dashboard with unified data — spend, revenue, and sources — can look like. No more juggling interfaces or manually compiling reports. With this setup, you get actionable insights in just a few clicks:
So, what’s the logic for identifying sources in E-commerce? It differs quite a bit from SaaS, which I described previously. In E-commerce, you can’t always say that the first source — the one that brought in a customer — is the most important. Ideally, you'd measure the impact of every interaction between you and the customer. But the minimum you should aim for is to know the source on three levels, because this enables multi-level reporting and better attribution modeling. Specifically, you need to collect:
- Order Source – what actually brought in the money
- Customer Source – what triggered the first purchase
- First Visit Source – how the customer first discovered you
Why isn’t the order source enough? If that’s all you collect, you’ll only see which channels help convert at the final stages of the funnel — when demand is already there, or when the customer is familiar with your brand and making a repeat purchase. That’s why you’ll see higher proportions of brand campaigns, branded SEO, and email in this data. However, these channels usually have low incrementality — meaning they don’t strongly influence the purchase decision. You won’t scale your sales effectively by just increasing investment in these channels.
That’s why it’s crucial to also pay attention to the sources that led to the first purchase, and even earlier — the first interaction with your business. Without those, the purchase likely wouldn’t have happened.
Best practice: Collect this data yourself — do not rely solely on third-party tools like GA4. To implement this, you’ll need to define your source-tracking logic and ask your developer to store it in cookies. Then, when a user completes a goal action (like making a purchase or submitting a form), those source details should be passed to your CRM/admin panel via hidden fields.
And don’t forget — not all orders are placed through the website. Some (sometimes a significant share) are entered manually by sales managers after direct contact with the customer. If most of these happen over the phone, you’ll need call tracking — a service that assigns a unique phone number to each website visitor. When a user calls that number and makes a purchase, you can track the source of the call, and therefore, the order.
A small caveat here: I’m simplifying by calling the number “personalized” — it’s not truly assigned to a specific individual, but for the purpose of this article, we’ll skip the technicalities of call tracking systems.
Still, there will always be some orders entered by managers without the website being involved. In these cases, every business should encourage and motivate their sales team to record the source of these orders in the designated field within the CRM or admin panel.
And speaking of motivation — your traffic specialists should be consistently tagging all links to the site with UTM parameters whenever possible.
Without proper UTM tagging, your end-to-end analytics is worthless.
Only a comprehensive approach like this will allow you to identify revenue sources reliably — and only then will your end-to-end analytics actually make sense.
Profitability Metrics
These metrics combine costs and revenue to give a clear view of your investment efficiency.
Return on Ad Spend (ROAS) is the most basic — and arguably least useful — formula:
ROAS = Ad Revenue / Ad Spend
I believe its only real value is helping you decide what ROAS target to set in your ad campaign settings :)
Yes, you can include it in your reports — it’s more informative than CR (conversion rate), but still very limited. It only gives a rough idea of how well your ad campaigns are performing from a profitability perspective.
Ad Spend Share (inverse ROAS, often called DRV in Ukrainian practice) is just the opposite:
Ad Spend Share = Ad Spend / Ad Revenue
The value of this metric is similar to the previous one, but it gives you a quicker sense of whether your campaigns are profitable. For instance, if you know your average margin is 20%, you can easily tell whether a campaign is profitable based on whether your ad spend share is below or above 20%.
But again — it’s still an approximation.
Gross Profit is a much more useful metric and one you should aim to include:
Gross Profit = Revenue – COGS – Marketing Spend
You may have seen versions where Gross Profit = Revenue – COGS, but in our opinion (and our clients’), marketing spend should also be excluded here to better reflect true profitability.
Gross Margin is the relative version of gross profit, showing the relationship between revenue and costs to sell goods + marketing:
Gross Margin = Gross Profit / Revenue × 100%
These two — Gross Profit and Gross Margin — are the minimum viable metrics you need to understand whether your variable costs (those that scale with sales volume) are paying off.
Net Profit goes a step further by including operational and non-operational costs too:
Net Profit = Revenue – Total Business Expenses
This is the absolute metric that shows the overall profitability of the business. Naturally, it’s great when this is above zero. If it’s below, your business is losing money rather than earning it.
Net Margin is a relative metric that shows how well your business is doing — how much net profit you’re earning per each unit of revenue. If the value is above 0%, that’s good; if it’s negative, that signals trouble.
Net Margin = Net Profit / Revenue × 100%
ROMI (Return on Marketing Investment) reflects how much net profit you’re getting specifically from your marketing investments. If the number is over 100%, your campaigns are profitable. If it’s below 100%, you’re losing money. Formula:
ROMI = (Net Profit – Marketing Investment) / Marketing Investment × 100%
Unlike Net Margin, which shows the overall profitability of the business, ROMI focuses purely on the return from marketing activities. A high ROMI indicates successful marketing — but it doesn’t guarantee overall profitability. Your Net Margin might still be low due to high product costs, logistics, or operational overhead.
Let’s look at a simplified example: You invest $10,000 into Google Ads. From that campaign, you earn $30,000 in net profit.
ROMI = (30,000 – 10,000) / 10,000 × 100 = 200%
This means your Google Ads brought in a 200% return on the original investment.
But let’s say the total revenue from that source was $300,000.
Then your Net Margin would be:
Net Margin = (30,000 / 300,000) × 100 = 10%
So while your ROMI reflects the efficiency of your marketing spend, Net Margin shows the broader profitability picture. Both metrics must be present in your reports if you want to understand your biggest growth opportunities — whether through optimizing marketing investments, or cutting operational costs.
Conversion Rate Nuances
Why didn’t I include one of the most classic metrics — conversion rate (CR) — in the sections above?
Because I believe it doesn’t hold much value in a list of metrics that are primarily about money — and should stay about money. The only real case for using CR is when you can’t include anything related to cost or margin in your report.
Metrics like ARPU vs CAC or AOV vs CPO are far more meaningful and insightful.
A high conversion rate isn’t a sign of success if your average order value is low. And conversely, a relatively low CR doesn’t necessarily mean something’s wrong if your AOV is high.
It’s much better to measure business success in money.
Another issue with CR is the inconsistency of how it’s calculated. I’ve seen all of these:
- Orders / Clicks
- Buyers / Clicks
- Orders / Sessions
- Buyers / Sessions
- Orders / Unique Visitors
- Buyers / Unique Visitors
The last one makes the most logical sense to me: people visit the website, and people make purchases — so it’s reasonable to compare people to people. But as you’ve probably noticed, I haven’t mentioned website visitors until now — and that’s intentional. We can’t collect 100% of visitor data. From ad blockers to consent preferences, there are many reasons we lose visibility. That’s why I believe it’s incorrect to calculate conversion using 100% of buyers and only 80% of site visitors.
But here’s what we do know for sure: clicks. Clicks are actions. So are orders. So a formula like Orders / Clicks can be a reasonable workaround when you don’t have access to cost or margin data. Still — don’t treat CR as a KPI. The formula can mislead, especially when you’re working with small volumes of data. For example:
- A user makes 1 click and 2 orders – CR = 200%
- Another user makes 2 clicks and 1 order – CR = 50%
Yes, this is a crude example, but it illustrates how conversion rate can vary by 4x on what seems like the same data.
Summary
You’ve just gone through a very detailed section — so here’s a consolidated summary table with all the metrics we’ve covered, to give this information a more structured form:
| Metric | Formula | Description |
|---|---|---|
Impressions | The number of times your ad was displayed to users. | Used to track how often your ad was shown. |
Clicks | The number of times users clicked on your ad. | Used to measure how many interactions your ad generated. |
CTR | Clicks / Impressions | Indicates how engaging or relevant your ad is and how often it drives users to click. |
Marketing Spend | The total amount spent on marketing and advertising activities. | Helps you understand the overall investment in promotion efforts. |
CPC (Cost Per Click) | Spend / Clicks | Shows the average amount you pay for each click on your ad. |
Number of Orders | Number of Successful Orders | The total number of completed orders that generated revenue. |
Number of Customers | The number of customers who placed at least one successful order. | Indicates how many unique buyers contributed to your company’s revenue. |
% of First Orders | Number of first-time customers during the selected period / Total number of customers | Helps assess how effectively you’re attracting new customers. |
COGS (Cost of Goods Sold) | The total cost of goods sold, including delivery, commissions, etc. | When combined with marketing spend, it helps determine total business expenses. |
CAC (Customer Acquisition Cost) | (COGS + Marketing Spend) / Number of new customers | The amount of money you need to invest to acquire a single new customer. |
CPO (Cost Per Order) | (COGS + Marketing Spend) / Number of successful orders | The amount of money you need to invest to generate a single order. |
Revenue | The total amount of money received from customers for successful orders. | Used to understand the overall income the company earns from product sales. |
AOV (Average Order Value) | Revenue / Number of successful orders | Shows how much revenue you earn on average per successful order. |
ARPU (Average Revenue Per User) | Revenue / Number of customers (preferably calculated cohort-wise from the moment of acquisition) | Indicates the average amount of revenue earned from a single customer over their lifecycle within a specific cohort. |
ROAS (Return on Ad Spend) | Ad Revenue / Ad Spend | Shows how much revenue your advertising generates relative to how much you invest in it. |
Ad Spend Share | Ad Spend / Ad Revenue | Represents the share of advertising costs in your total revenue. |
Gross profit | Revenue – COGS – Marketing Spend | Profit after subtracting product and marketing costs, but excluding operational expenses. |
Gross margin | Gross Profit / Revenue × 100% | The percentage of revenue that remains after covering product and marketing costs. Does not exclude operational expenses. |
Net profit | Revenue – Total Business Expenses | The profit remaining after all business expenses have been deducted — including costs for product fulfillment, marketing, and operations. |
Net margin | Net Profit / Revenue × 100% | The percentage of revenue that remains as net profit. This metric accounts for all business expenses, reflecting overall business profitability. |
ROMI (Return on Marketing Investment) | (Net Profit – Marketing Investment) / Marketing Investment × 100% | Shows how profitable your marketing campaigns are. A value over 100% means your marketing is generating more profit than it costs. |
About Customers
This section focuses on key directions for analyzing your customer base and interactions — with the goal of improving both new customer acquisition and existing customer retention.
LTV Nuances
Ah yes, the magical metric — LTV (Customer Lifetime Value) — the holy grail of marketing. Together with CAC, it helps you evaluate your unit economics simply by comparing how much it costs to acquire a customer vs. how much that customer brings in.
The tricky part about calculating LTV is that you need to know how long a customer continues to interact with your business. In SaaS, this is relatively easy — subscription models make it clear: if someone cancels, they’re no longer a customer.
But in E-commerce, it’s almost impossible to tell exactly when a customer stops being a customer.
You can try estimating average customer lifetime empirically. Let’s say you sell freshly roasted coffee — and that’s all. On average, your customers place a repeat order every month. You could look at those who haven’t ordered in the last 2–3 months, and calculate the average time (in months) between their first and last order. That becomes your lifetime.
Then, calculate the average number of orders and average order value for those customers. Your LTV is simply:
Lifetime × Average Number of Orders × Average Order Value
While this formula is clear, unfortunately it won’t work for every business — many E-commerce companies can’t estimate customer lifetime with enough confidence. But if you can — that’s great! You’ll be able to assess whether your acquisition costs are justified (even if a customer is unprofitable initially), and you’ll gain a clearer benchmark for acceptable CAC levels, allowing you to scale more aggressively and strategically.
Cohort Analysis
But what if you can’t tell when a customer has “left” your business? Then you can use a very insightful workaround — cohort analysis using cumulative return on investment (also known as running total).
Here’s how to structure it:
- Define your monthly variable costs — COGS + marketing spend.
Variable costs are those that rise or fall depending on the number of orders. Fixed costs (like operations) are not included in this calculation. - Build 30-day cohorts, where rows represent the month of customer acquisition, and columns represent time since acquisition. For example: Cohort 0 = revenue earned from day 0 to day 29, сohort 1 = revenue earned from day 0 to day 59, сohort 2 = revenue earned from day 0 to day 89
… and so on.
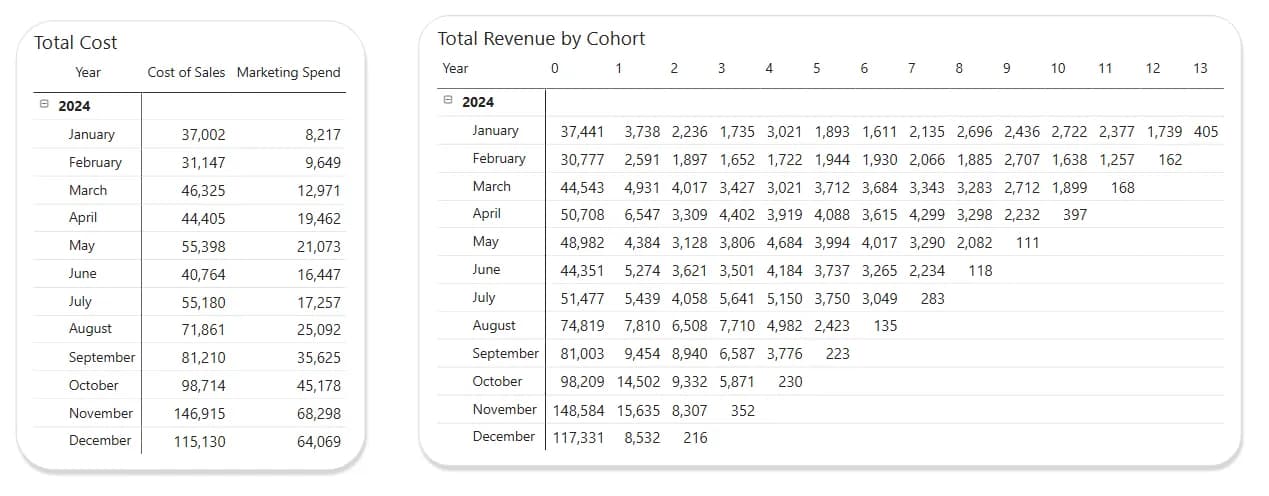
3. Calculate the running total revenue per cohort. That means: сohort 0 = revenue from day 0 to 29, сohort 1 = revenue from day 0 to 59, сohort 2 = revenue from day 0 to 89 etc.
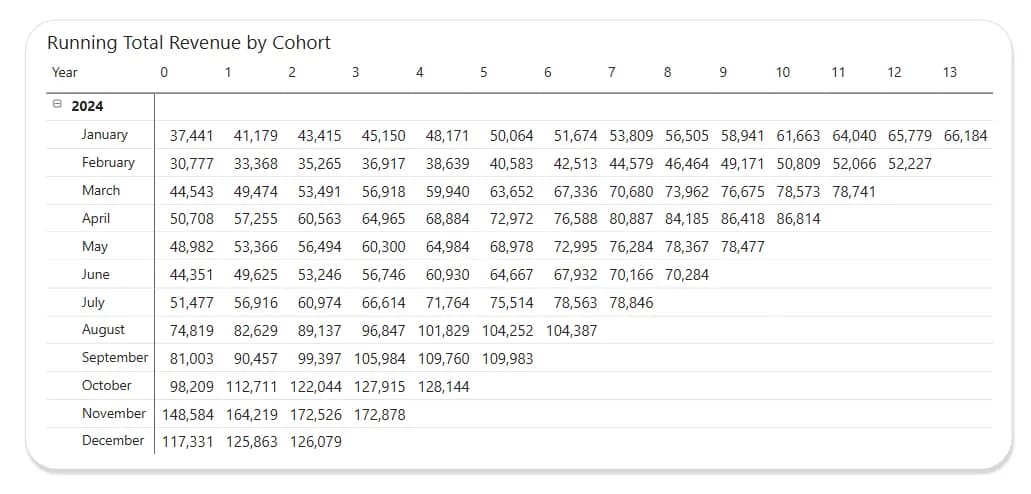
4. The final step is to divide the running total revenue by the total cost — this allows you to instantly see, for example, that on average, customer acquisition starts to break even after 4–5 months (when the ratio exceeds 1). At the same time, you might notice that something’s off — for example, your September and October cohorts haven’t reached breakeven even by their 4th or 5th month.

Important note: What starts to break even here are your acquisition investments — meaning the ratio becomes greater than 1. This does not mean you’ve started generating net profit — fixed costs are not factored into this breakeven point. They must be excluded from this calculation, as they are not part of your customer acquisition cost.
In general, cohort analysis is a powerful technique because it allows you to track what happens to your customers over time. Total figures won’t give you this kind of insight — they mix together data from brand-new customers with those who have been with you for years.
But when you add the ability to filter cohorts by acquisition source and/or ad campaign, you can easily determine which marketing efforts are paying off — and when — and which ones are not, so you can cut them.
And building cohort reports isn’t limited to the example above. The core idea remains the same: you group people based on a shared trait at the moment of their first action, then observe their behavior as time progresses.
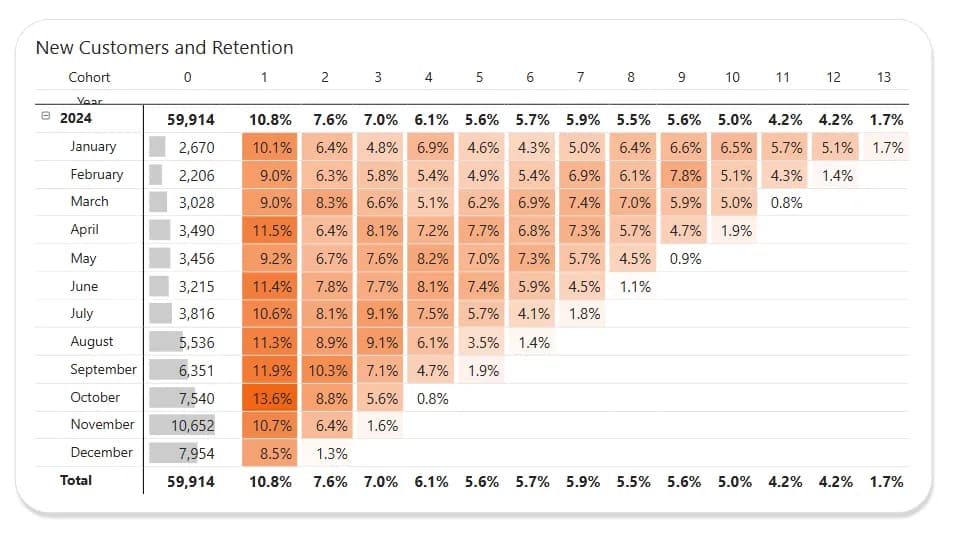
A classic cohort use case is Retention. It shows how often your customers return to complete a target action — like making a repeat purchase. It helps you evaluate the effectiveness of your loyalty programs. You can also detect seasonality in product demand and plan your marketing campaigns accordingly to boost repeat orders.
Here’s an example of such a retention cohort. As you can see, this business is doing fairly well in terms of retention. And the seasonal pattern is obvious — both new and returning customers are more active in autumn.
Cohort analysis is a must-have for e-commerce. You can group customers not just by acquisition time but by almost any customer attribute. For example:
- First-touch source or specific ad campaign
You’ll be able to check whether a source or campaign brings in people who come back for repeat purchases. You can also compare cumulative revenue to cumulative spend over time and identify when (or if) your investment pays off. - Category of first purchase
Helps you identify which product categories drive first-time conversions more often, whether they lead to repeat orders, and if so — when, how frequently, and how seasonal the behavior is for that specific category. - Discount level at first purchase
Trying to attract new buyers with discounts? Create cohorts based on the size of the discount. You might find that offering a bigger first-time discount doesn’t pay off — people may not return at all.
As you can see, cohort analysis is limited only by your imagination — and it can answer a wide range of questions about your marketing performance.
Customer and Revenue Types
I previously detailed this approach in the context of SaaS, but it fits perfectly in e-commerce too.
It helps you segment your customers into meaningful types — rather than just looking at one flat total, which isn’t very informative on its own.
Create a table or chart broken down by month, and categorize customers using the following logic:
- Number of buyers / total revenue for the selected month — to get a high-level view.
- New customers and their first-order revenue — this helps you understand whether you’re actively acquiring new clients. Calculate their share relative to the total customer base to get your Growth Rate — the pace at which your customer base is expanding.
- Lost customers — define the approximate time frame that should pass after a customer's last order to consider them lost. This will allow you to calculate churn. Combined with new customer metrics, you’ll be able to understand retention — are more new customers coming in than you're losing? Additionally, you can calculate the revenue from these lost customers over the past 12 months and treat it as lost revenue.
- Temporarily lost customers — those who hadn’t ordered anything at the time of analysis but later returned or might still return.
- Reactivated customers — those who made a new purchase after having previously been considered lost.
- Repeat customers — likely needs no explanation :)
Such segmentation gives you a complete understanding of customer acquisition trends, repeat purchases, and churn.
RFM
This technique is even more relevant for e-commerce than it is for SaaS. It’s based on segmenting your customer base according to how recently someone made a purchase (Recency), how often they buy from you (Frequency), and how much they spend on average or in total (Monetary Value). This kind of analysis helps you identify your most valuable customers, re-engage those who haven’t purchased in a while, and generally tailor your communication strategy by targeting people based on real behavioral data rather than sending blanket campaigns to everyone. Audience creation and updating for such email or advertising campaigns can be easily automated, enabling your marketing to show up “at the right time, in the right place.” This improves conversion rates compared to when your messaging is sent to people for whom it's completely irrelevant.
In addition, RFM helps you proactively identify customers who are about to churn and offer them something special to make a repeat purchase. This kind of offer will almost always be cheaper than acquiring a new customer, while also increasing that customer’s lifetime value and reducing the risk of losing them to a competitor.
Building this analysis isn’t complicated. You assign each customer a score from 1 to 5 for each of the three criteria. A score of 1 reflects the longest time since the last purchase and the lowest frequency and spending, while a score of 5 indicates the most recent purchase and the highest frequency and spending.
Building this kind of analysis is not difficult. You need to rank your customers based on the three metrics and assign them a score from 1 to 5, where 1 represents the highest Recency (i.e. the longest time since the last purchase) and the lowest Frequency and Monetary Value, while 5 represents the lowest Recency (most recent activity) and the highest Frequency and Monetary Value.
And then, once you have your customers scored across all three RFM metrics, you can segment your base accordingly. For example:
- VIPs (555) — these are your most valuable customers. Offer them loyalty programs to make sure you don’t lose them.
- Potential loyalists (443, 444, etc.) — they could grow into VIPs with the right encouragement, such as exclusive discounts.
- One-time buyers (111, 211, etc.) — those who’ve purchased the least and are almost lost. You can try to re-engage them, but it’s probably not worth investing too much — your offer may have been relevant to them only once, and they’re not planning to return.
- High-value at risk (344, 433, etc.) — these customers generated solid revenue in the past but haven’t purchased in a while. It’s worth trying to bring them back with a special offer.
These are just general examples. To build more relevant segmentation for your own base, you’ll need to study user behavior and define your own criteria for dividing customers into groups.
A more advanced approach to RFM is using it to track how your segments change over time. For instance, today your segments look a certain way. You launch an email campaign targeting specific groups. A while later, you go back to the report, select the campaign start date and the current date, and evaluate the impact: how many people came back and turned into VIPs, and how many didn’t. That gives you a clear understanding of how successful your communication actually was.
One day I’ll show you what this looks like in practice — but that’s another story, so stay tuned :)
Final Thoughts
The main takeaway from this article for e-commerce: consolidate all your costs and revenue in a single dashboard. As one of our clients once said, this lets you get valuable insights in just two clicks.
Also, don’t forget the importance of proper UTM tagging — it helps you quickly understand which activities are actually generating profit. Make sure to analyze your data using multiple attribution models, because every channel contributes to revenue in its own way — even those that don’t drive direct conversions but serve as the first touchpoint. Without attribution-based analysis, it’s easy to overlook a key channel and later wonder why turning off an “ineffective” campaign made your sales tank.
Lastly, keep an eye on your customer base — track how it’s growing and invest in retaining those you already have. And from our side, if you choose to trust our team with your analytics setup, we’ll help you keep your finger on the pulse with full-cycle, data-driven insights.
Comments
Share your thoughts and ask a question
Loading comments...