

Maks Hapchuk
Founder of PROANALYTICS.ACADEMY & Web Analyst & MarketerMarketing Analytics for Business: From Goals and KPIs to Data Architecture
Marketing without analytics is like trying to plan a route through an unfamiliar city without a map or navigator. You can drive around aimlessly for a long time, burning fuel, time, and resources, but never actually reach your destination.
A few years ago, a good product was the foundation of marketing. A good product still hasn't lost its relevance today, but it's no longer enough on its own. Competition has intensified, information noise has grown, and user attention has become a limited resource. Now the main competitive advantage is the ability to acquire, retain, and monetize users. And of course, analytics data is what helps us do that.
Analytics allows us to understand:
- which channels actually bring in customers, and which ones just "eat" the budget;
- at which stage of the funnel we lose the most potential buyers;
- what drives repeat sales;
- how to test hypotheses faster and scale what works;
- and of course, this is just part of a much longer list.
In this article, I'll break down what marketing analytics is, why it's critically important for business, and how to start moving toward marketing analytics that isn't just "yet another report nobody opens," but actually works toward achieving real business results.
- What Is Marketing Analytics
- Why Marketing Analytics Is Needed and What It Includes
- How a Business Can Start Implementing Marketing Analytics
- Defining Goals and Objectives and the Key Metrics (KPIs) to Measure Them
- Choosing Tools and Designing a Data Architecture
- Identifying the Data Sources Reports Will Be Built On
- Choosing Tools for Marketing Analytics
- Which Is Better: Connecting a BI System Directly to Your Data Sources, or Building Marketing Analytics Using a Data Warehouse?
- Which Data Warehouse Should You Choose for Marketing Analytics?
- Which BI Systems Are Best Suited for Marketing Analytics?
- What Else Is Important to Consider When Choosing Marketing Analytics Tools
- An Example of Selecting a Data Warehouse and BI System for Marketing Analytics
- Data Collection
- Data Processing and Visualization
- Instead of a Conclusion
What Is Marketing Analytics
Many people see the process of building marketing analytics as simply building reports:
- Sometimes I come across businesses for whom all of marketing analytics boils down to correctly setting up GA4 and conversions in the ad account. And they think that's genuinely enough: you set it up once and you're done.
- Sometimes these are more advanced businesses that want full-funnel analytics reports that include data from ad accounts, Google Analytics, CRM, and other marketing and analytics systems the company uses — that's already a step forward. But even that kind of report still isn't enough.
Analyzing the performance and profitability of marketing campaigns is certainly good. But your marketing doesn't end there. Moreover, marketing analytics isn't just reports, and it isn't a one-time study. It's a process. Even the best report won't deliver results if you don't know how to work with it, or if it wasn't built for your specific project and tasks.
What's more, even if you have the best report — one that perfectly covers your current needs, presents the most accurate information about your business in the most convenient format for decision-making, and one that your entire team absolutely loves — that's still just the beginning.
Your product changes over time. Your understanding of the business changes over time. New answers give rise to new questions. And given that, your analytics can't stay in one place. If you were to ask me for the one single takeaway I'd want you to remember from this piece, it would be this:
Working with data is a process that never ends.
Why Marketing Analytics Is Needed and What It Includes
We've already established that marketing analytics is more than just reports. But what actually is it?
The main goal of marketing analytics is to improve marketing effectiveness and enable informed decision-making. There are different approaches to how marketing analytics should be broken down, depending on the type of task, the analytical approach, and so on. In today's piece, I'll focus on the logic of the stages of visitor/customer interaction:
- Analysis of marketing activities for acquiring new visitors/customers — often simplified and just called traffic channel analysis — is usually the stage that gets analyzed the most. And it's no coincidence, since it usually accounts for the largest share of the monthly budget. But, as I wrote above, traffic is only the beginning; from there it leads the visitor somewhere (usually to a website).
- Analysis of interaction with the platform where communication takes place (usually the website that traffic is being driven to) — here the situation is often the opposite. Many business owners for some reason believe that a website is built once in a lifetime and that theirs turned out perfectly. But that's far from true.
- What happens after the lead is submitted — sales and repeat sales. Here, I often encounter the view among businesses that marketing has nothing to do with this — that it's simply not marketing's area of responsibility. To such people, I'd love to gift a copy of Kotler's book, which hasn't lost its relevance and reminds us of a simple truth: marketing is a mix of the 4 Ps — product, price, place (in our case, most often meaning the website), and promotion (simplified: advertising). A marketer who can't see what happens after the website interaction is blind.
For those who aren't fans of the classics and want something more modern — look at AARRR (Acquisition, Activation, Retention, Referral, and Revenue), a related concept that shows things from a slightly different angle.
Now let's put it all together into one picture:
Marketing analytics is the process of collecting, analyzing, interpreting, and — most importantly — making decisions based on data about interactions with real and potential customers at every stage of their lifecycle, starting from the moment they see an ad, and ending... There is no "ending" — after all, we want the customer to always stay with us, right?
Of course we don't want customers to leave us, but if that does happen (a process called churn), then analyzing it is also part of marketing analytics.
Now that we've figured out what marketing analytics actually is, let's dig a little deeper to understand how it's all really interconnected.
Traffic Channel Analytics
When we talk about traffic channels, we primarily mean the ad accounts through which a business acquires visitors: Google Ads, Meta Ads, TikTok Ads, and others. This is where the user's journey begins, and analytics should show which channels traffic is coming from, its quality, and what sales and customers it has brought us.
The best approach is to build end-to-end analytics that shows where money is being spent and what return we're getting on our investment. Calculating the LTV-to-CAC ratio, or at minimum ROAS and ROMI, is ideal for this.
Of course, in practice this isn't such an easy task — you'll need to account for attribution and situations where data is missing, for example when a user hasn't consented to data collection on the website and the data has to be modeled. But the direction should still be toward full-funnel analytics and building data-driven attribution tailored to a specific business.
I've written about this in more detail in my previous article, "Web Analytics Evolution: from ‘just looking at numbers’ to ‘making informed decisions’'" And there's an excellent piece on different approaches to attribution by one of my colleagues.
Website Interaction Analytics, or Where We're Losing Visitors
Good marketing analytics helps you understand not only whether your ad spend paid off, but also at which stage you lost potential customers. We always start by looking at costs and revenue, but the real job of analytics is to dig deeper and ask the right questions: "Can we earn more while spending less?" or "Can we increase revenue while keeping costs at the same level?"
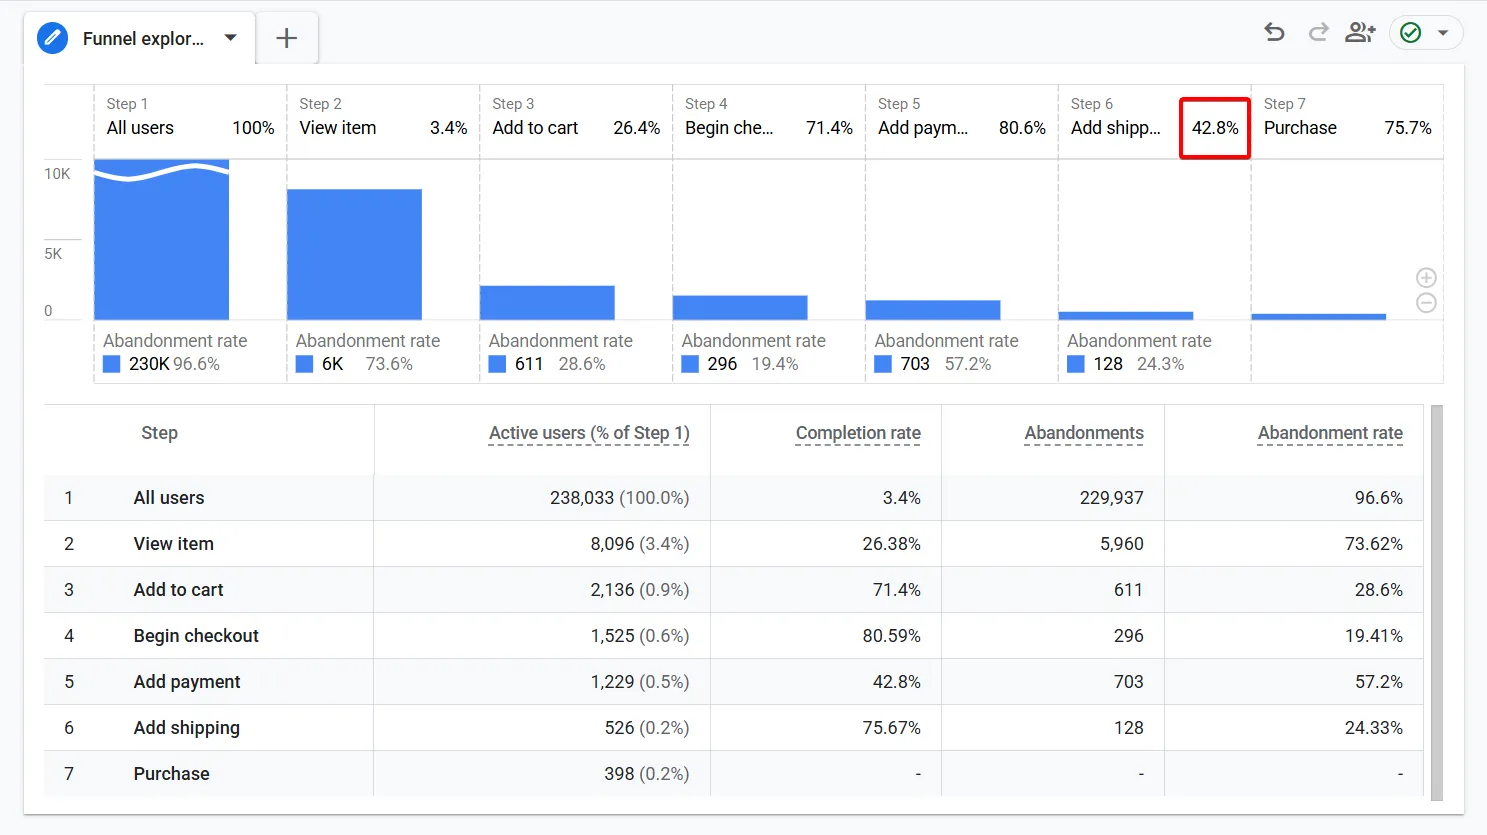
Of course, there are many different approaches here, so I'll focus on the clearest and simplest one: analyzing the user journey in the form of a funnel. We can build funnels for specific tasks to highlight problem areas and understand where we're losing customers. For example, we can create a funnel for the path to purchase and see at which stages a lot of people drop off. Pretty simple, clear, and visual. From a simple report like this, I can already spot something important: only 42% of visitors to our site who spent time searching for a product, added it to the cart, went to the checkout page, filled in their personal details, selected a payment method, and chose a shipping method actually completed the process. The other 58% of visitors who went through this path left the site between choosing a payment method and choosing a shipping method, due to a bug on the site between these two steps (the bug example here is hypothetical — the current example report doesn't actually show this, but of course this is something that could be investigated to understand the cause). Just think about it: this problem had existed on the site for a long time, and you simply didn't know about it, so you were losing real orders. And that's just one example of why it's important to analyze interaction with your website.
Repeat Sales Analysis
Now that we understand how we bring in customers and how we can do it more effectively by improving site conversion, there's one more important aspect: repeat sales.
For most companies, this is a very important stage, since acquiring a repeat customer is often cheaper than acquiring a new one. Here's an interesting confirmation from practice: ForEntrepreneurs by David Skok, together with Pacific Crest Securities (now KeyBanc Capital Markets), conducted a large study among 305 SaaS companies from around the world. Participants were business owners and executives with an average annual revenue of $4 million.
The results showed that to generate $1 of new revenue from a new customer, companies spend an average of $1.18. Meanwhile, additional sales to existing customers cost only $0.28, and contract renewals cost $0.13. In other words, retaining customers and selling to them again is several times cheaper than acquiring new ones.
Repeat sales increase LTV (customer lifetime value) and also improve overall marketing profitability. That's exactly why working smart with existing customers is one of the most effective ways to grow a business.
How does analytics help with repeat sales? Again, I'll illustrate this with just one example: cohort analysis.
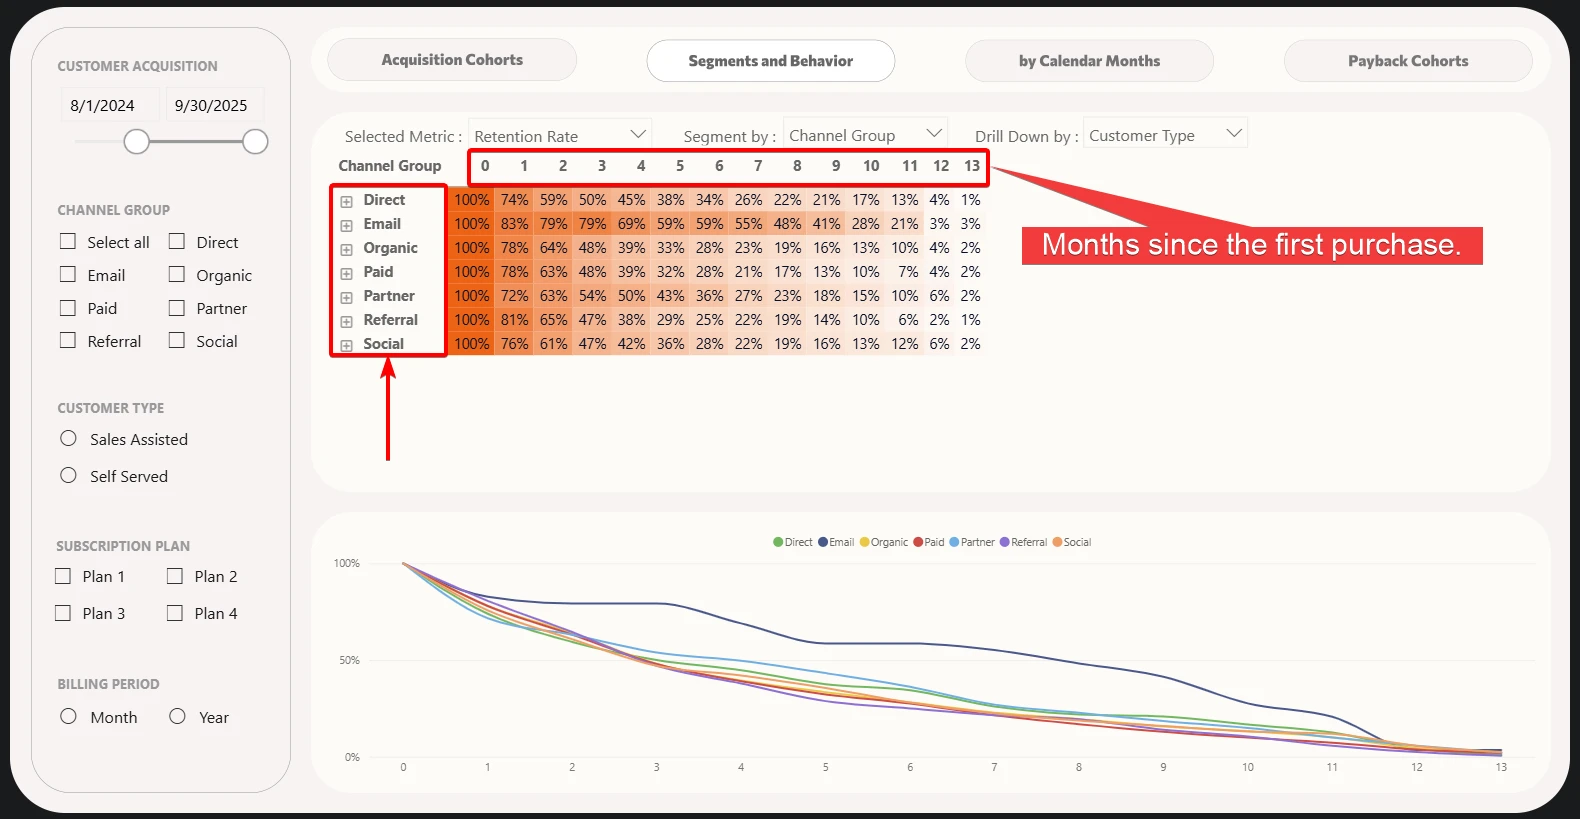
Cohort analysis helps you see customer behavior over time, rather than just aggregate numbers where new and returning buyers are all mixed together. It gives you a real understanding of how often customers come back, when exactly they make repeat purchases, and which marketing activities keep them engaged.
Below is an example from one of our reports, clearly showing what percentage of customers acquired through different traffic channels stay with us over a given period of time (in other words, what percentage keeps repurchasing our products or services).
Here's another example of a different type of cohort analysis, showing how our investment in a given channel pays back over time:
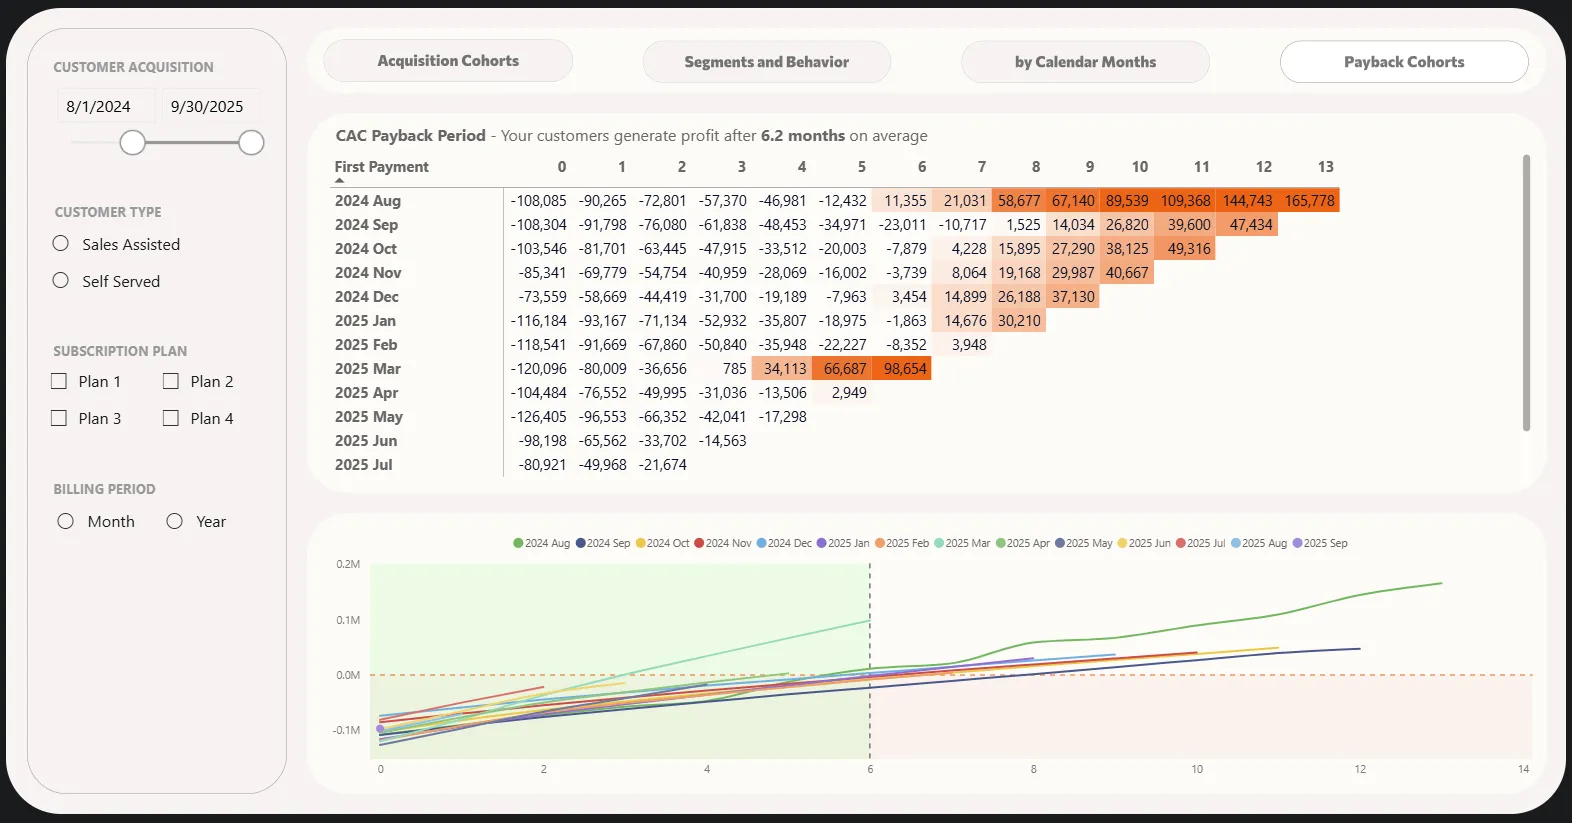
The principle is simple: you group users into cohorts by month of first purchase or by acquisition source, and then you track:
- how often they make repeat orders,
- how quickly acquisition costs pay back,
- which channels bring in loyal customers,
- how behavior changes depending on product category or discount size.
You can read more about approaches to cohort analysis for different types of businesses in an excellent article by one of my colleagues: "Cohort Analysis: Definition, Types, and Practical Examples"
Now that you know what marketing analytics consists of based on real examples, let's break down how to implement it.
How a Business Can Start Implementing Marketing Analytics
For marketing analytics to actually work, rather than remain a collection of pretty reports, you need a systematic approach.
It usually includes the following stages:
And it's precisely in this order — not the way it often happens in practice, where you first set up data collection through a set of tools, and only afterward start thinking about what to actually do with it and how the data should fit together into a single picture.
- Defining goals and objectives and the key metrics (KPIs) to measure them.
- Choosing tools and designing a data architecture.
- Data collection.
- Data processing and visualization.
- Data analysis, hypothesis testing, and interpreting results.
- Making management decisions and implementing changes.
- Monitoring and evaluating effectiveness.
Since this article is only the first in a series, I'll focus on the first few points from this list.
Defining Goals and Objectives and the Key Metrics (KPIs) to Measure Them
Defining Business Goals and Objectives
Before setting up analytics, you need to clearly understand which business goals you want to achieve with data. Yes, that's exactly where everything starts — not with building reports, but with goals and objectives. And it's based on these that, in the next step, you'll be able to choose the right tools for solving your tasks.
For the sake of clarity, let's walk through a simple, classic example: increasing repeat sales.
A good starting point is to formulate the questions you want answers to. In this case, those might be the following questions (this list isn't exhaustive and is provided for demonstration purposes only):
- Do we currently have repeat sales?
- How has the percentage of repeat purchases changed over the past year?
- Which products/services do customers who buy repeatedly purchase most often?
- Which channels most often bring in users who make repeat purchases?
The answers to these questions will actually form the basis of one of your marketing reports. And with that, we've arrived at another important point to understand: marketing analytics is far from being just one report.
You'll find more practical tips on what's worth paying attention to in e-commerce in the article "Marketing Analytics for E-commerce." And for SaaS, you can read more in the article "The Ultimate Guide to SaaS Analytics: Key Metrics and Their Importance."
Choosing Metrics and Parameters for the Report
Let's move straight into an example: usually, each question from the previous point can be translated into a specific set of metrics and parameters. Here's what that might look like:
Again, to keep the article shorter, from here on I'm giving only a simplified example. In real life, it's hard for me to imagine, for instance, analyzing repeat sales without also analyzing the revenue and profit that those repeat sales generate.
| Question | Metrics | Parameters |
|---|---|---|
Do we currently have repeat sales? | Number of repeat purchases, % of repeat purchases out of total, Number of customers who made a repeat purchase, % of total revenue generated by repeat sales, % of profit generated by repeat sales | |
How has the percentage of repeat purchases changed over the past year? | Number of repeat purchases, % of repeat purchases out of total, Number of customers who made a repeat purchase, % of total revenue generated by repeat sales, % of profit generated by repeat sales | Purchase date (day, week, month, year) |
Which products/services do customers who buy repeatedly purchase most often? | Number of repeat purchases, % of repeat purchases out of total, Number of customers who made a repeat purchase | First product/service purchased by the customer; product/service purchased in the current transaction |
Which channels most often bring in users who make repeat purchases? | Number of repeat purchases, % of repeat purchases out of total, Number of customers who made a repeat purchase | Traffic source and channel, marketing campaign (with deeper granularity if needed) |
Choosing Tools and Designing a Data Architecture
Identifying the Data Sources Reports Will Be Built On
Now that we have the metrics and parameters we need, it's time to figure out which systems we'll pull data from in order to eventually build a report out of them. But sometimes, as often happens, we may have several "sources of truth": for example, sales data might exist in Google Analytics 4, in ad accounts, and in the CRM. So I'll rephrase slightly: what we actually need to figure out is where the data we need is most accurate.
Let's try to map this out for our example.
| Metric/Parameter for the Report | Base Metric/Parameter | System |
|---|---|---|
Number of repeat purchases | Purchase ID, Customer ID, Purchase date | CRM |
% of repeat purchases out of total | Purchase ID, Customer ID, Purchase date | CRM |
Number of customers who made a repeat purchase | Purchase ID, Customer ID, Purchase date | CRM |
Purchase date (day, week, month, year) | Purchase date | CRM |
First product/service purchased by the customer | Purchase ID, Customer ID, Purchase date, Product/service sold within the transaction | CRM |
% of total revenue generated by repeat sales | Purchase ID, Customer ID, Purchase date, Revenue from the purchase | CRM |
% of profit generated by repeat sales | Purchase ID, Customer ID, Purchase date, Profit from the purchase | CRM |
Product/service purchased by the customer in the current transaction | Purchase ID, Customer ID, Product/service sold within the transaction | CRM |
Traffic source and channel, marketing campaign | Purchase ID, Traffic source and channel, marketing campaign | Google Analytics 4 |
Notice that I've added a separate column called "Base Metric/Parameter." Not all the metrics you need to solve the original task will be immediately available in the system as-is. So you'll usually need to decide which underlying data they'll be calculated from. That's exactly what I've listed in the "Base Metric/Parameter" column.
Now that you've done this groundwork, you can finally start deciding which tools you'll use to work with the data you need.
Choosing Tools for Marketing Analytics
Disclaimer 1. In my experience talking with people from various companies, they very often spend far more time than necessary analyzing which tools to use for marketing analytics, instead of focusing on what data is actually needed to make decisions. That's exactly why, in this piece, I want to shift the main emphasis away from tool selection.
And that's also why this section may come across as a set of bullet points rather than a complete instruction manual. I genuinely want to draw your attention only to the most important steps of this stage, since for the most part it doesn't deserve as much attention as it usually gets.
Once again — of course, I do think tool selection is very important, just not nearly as important, proportionally, as the amount of attention it tends to receive.
Disclaimer 2. You've probably heard of, or come across, countless SaaS services that promise perfect marketing analytics within their own interface. For the most part, such systems offer template-based solutions designed for ideal conditions. Full-fledged, modern marketing analytics can't be achieved through a single service — you need to think of it not as one specific tool, but as an architecture. That's exactly what I'll focus on here.
Which Is Better: Connecting a BI System Directly to Your Data Sources, or Building Marketing Analytics Using a Data Warehouse?
This is the first question you'll need to answer, since your entire subsequent architecture will depend on it. And although popular BI tools can, in some form, connect directly to various CRMs, GA4, and ad accounts, I strongly recommend — especially at larger data volumes — that you build a data warehouse.
I could talk at length about the advantages of this approach, but I'll focus only on the most important ones:
- The data in your warehouse belongs to you. If Google decides at some point to release a new version of Google Analytics, all your existing data will still be in your warehouse. If you ever decide to switch CRM systems, you won't need to worry about how to preserve your old data — it will already be in the warehouse. If your ad account happens to get blocked, all your previous results are already sitting safely in your warehouse, and so on.
- High performance and no limits. Direct connections to the APIs of ad platforms, CRMs, or other systems often come with rate limits (quota restrictions) and tend to work slowly. If you have a large volume of data, dashboards using direct connections will "hang" for minutes at a time. A warehouse, on the other hand, is optimized for fast reads, so reports load instantly.
- Preservation of historical data. Most services impose strict limits on how long data is stored. For example, standard GA4 only retains detailed user-level data for up to 14 months. In your own warehouse, your history is preserved for years, which is critical for trend analysis and comparing long-term periods (year-over-year).
Now that, I hope, you've decided to go with the data warehouse option, you need to decide on the warehouse itself.
Which Data Warehouse Should You Choose for Marketing Analytics?
Here you'll have a wide, but in practice fairly limited, set of choices. First, you'll need to decide whether you want a cloud-based solution or your own server. To cut to the chase — I'd strongly recommend choosing the cloud. This gives marketing more control, speed, and, if needed, even independence from the IT department, which, as we all know, is very important in today's world. And paying only for what you use is also usually more cost-effective from a financial standpoint. If anyone's interested in a more detailed overview of this, let me know in the comments and I'll definitely write a piece on it.
Among the cloud providers, I'd highlight three main ones:
- Google — although Google's cloud isn't as popular overall as Amazon's or Microsoft's, we shouldn't forget that we're specifically talking about marketing analytics. And in that space, Google has a huge number of tools that marketers use every day: Google Ads, Google Analytics, Google Merchant Center, YouTube, Google Play, and so on. All of Google's services integrate beautifully with its cloud. So if you don't already have any infrastructure in place for marketing analytics, this could well be your best option.
- Amazon — its cloud has fewer built-in connectors to Google's services (which are essential for marketing analytics), but since it's the largest cloud provider, if your product already lives there, it's a solution worth considering.
- Microsoft — its cloud is the second-largest player in the market, and if your office already runs on licenses from this company, why not choose its cloud as well?
I'll note that all three providers have excellent integrations with all the major BI players on the market.
I usually recommend choosing Google's cloud for marketing analytics specifically. But, of course, the choice is yours.
Which BI Systems Are Best Suited for Marketing Analytics?
Broadly speaking, tools that let you not only view reports but also work with data conveniently, combine different sources, and build your own dashboards are called business intelligence (BI) tools (please don't confuse them with data visualizers — that's a different thing). There are many such solutions on the market, but among the most well-known and proven systems, you'll most often come across: Tableau (Salesforce), Power BI (Microsoft), and Looker (Google). Your choice will most likely land on one of these.
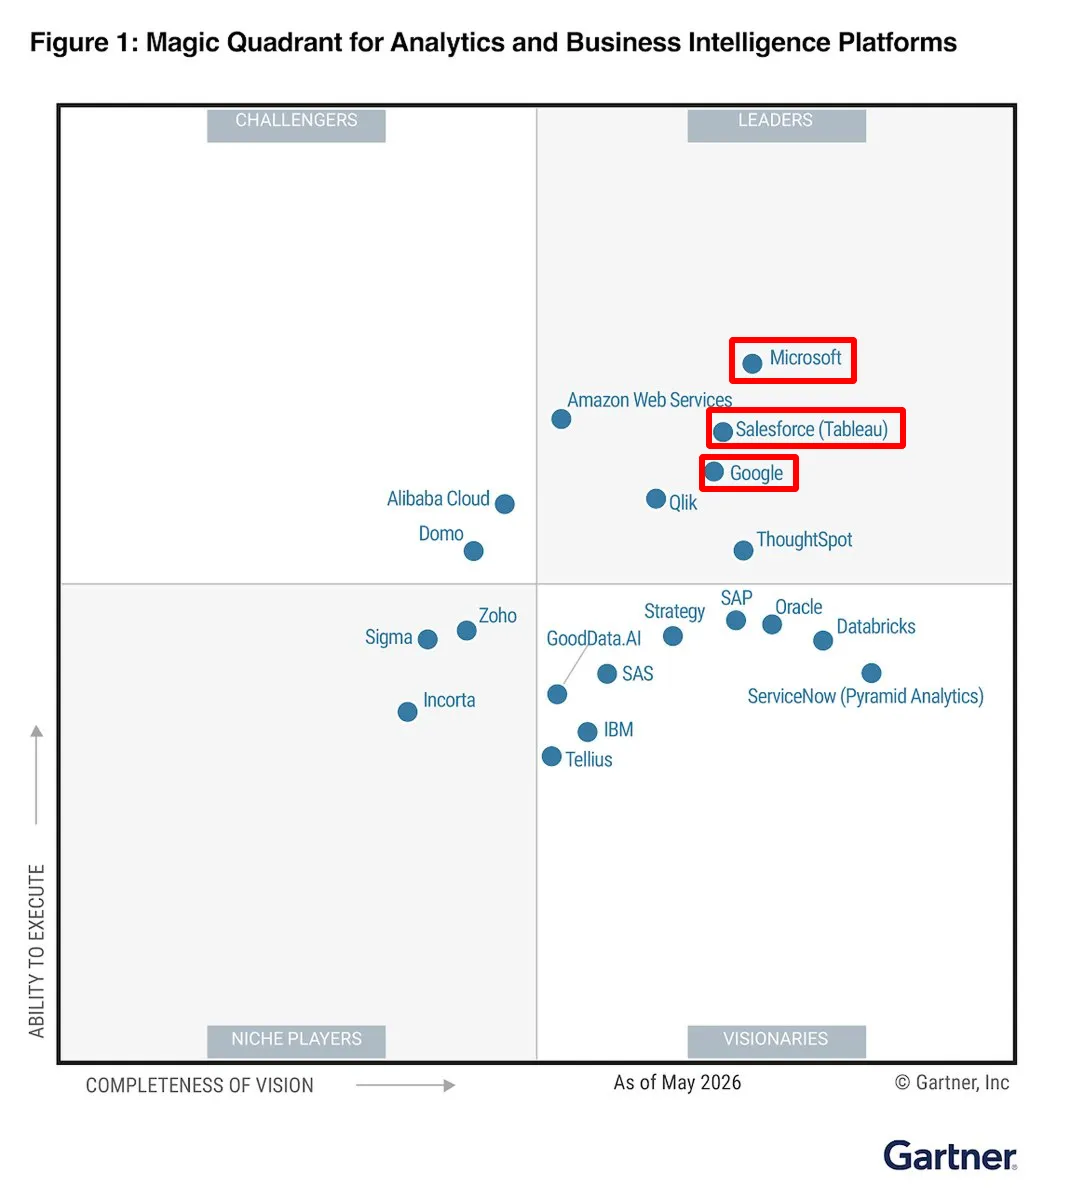
Source: Gartner Magic Quadrant for Analytics and Business Intelligence Platforms, 2026. Image published on the Google Cloud Blog.
Of course, besides the data warehouse and BI tool, there are usually additional tools that handle things like the ETL process or other necessary tasks, but choosing those is typically a more technical matter handled by the analytics team, depending on the specifics of the project. The choice of data warehouse and BI system, however, directly affects end users, so it's important for the marketing team to actively participate in that decision.
What Else Is Important to Consider When Choosing Marketing Analytics Tools
When choosing marketing analytics tools, it's important to build on the information you gathered in the previous stage (identifying data sources), as well as on your data volume, resources, and team experience:
- The information you gathered in the previous stage is the foundation. Naturally, the simpler and more native the integration between your chosen marketing analytics tools and the systems that serve as your data sources, the better.
- Data volume. While you can build the simplest reports in Google Sheets or Excel, such systems tend to start "choking" fairly quickly once data volume gets high enough. When evaluating your architecture, always consider how the system would behave if the data volume were 3–5 times larger than it is now.
- Team resources and experience. You might really like a given Power BI, but if the whole team knows how to work with Tableau, then obviously it's more efficient to choose Tableau instead. Or you might really want Tableau, but if the entire company runs on Microsoft services, then choosing Power BI is probably the more sensible decision.
An Example of Selecting a Data Warehouse and BI System for Marketing Analytics
Now, let's get more practical with our example. Imagine our hypothetical company has significant traffic volume (several million unique visitors per month), runs ads on Google Ads and Meta Ads, uses HubSpot as its CRM system, and uses eSputnik for email campaigns. It has no particular preferences regarding tools, since up to this point nobody has properly handled marketing analytics. As often happens, everything so far has stopped at setting up Ecommerce tracking in GA4.
In this case, the ideal data warehouse would be Google BigQuery, since it has built-in Data Transfer and Datastream functionality that allows you to set up data collection from all the relevant systems — HubSpot, Google Analytics 4, Google Ads, Meta Ads, and eSputnik — without involving the IT team. At the same time, it easily handles large data volumes and integrates beautifully with all the popular BI systems. What else is worth mentioning? BigQuery has built-in AI and ML capabilities for working with data, a Conversational Analytics data agent for quickly surfacing insights, and BigQuery MCP for connecting your own agents — for example, Claude Code or Codex — which means the system we're building won't become outdated in a few years.
As for the BI system, all three leaders — Power BI, Tableau, and Looker — would work perfectly well in this case, but I'd recommend going with Power BI, since among the three, its monthly subscription cost is the cheapest. And why pay more if you don't have to?
Data Collection
Disclaimer. Again, in this section I won't go into detail on specific tools, since there could be hundreds of different combinations (given the variety of CRM systems, ad accounts, and other marketing and analytics systems out there), so I'll only describe the key points worth paying attention to.
Now that you have a clear picture of the end goal — what analytics you want to get, and which systems will be integrated into your top-level analytics architecture — it's worth focusing on the following:
- Make sure all the data you need is being collected into your base systems, ideally automatically. For example:
- Are orders placed after customer phone calls actually making it into the CRM?
- Is the user identifier from Google Analytics 4 being passed into the CRM?
- Are purchases being tracked correctly in Google Analytics 4?
- Are all ad campaigns on Facebook Ads tagged according to our UTM tagging template?
- Set up automated data collection from the systems you need into your data warehouse. In our case, this is fairly straightforward, since the warehouse we chose already has built-in connectors to the systems we need via Data Transfer and Datastream. But sometimes you'll need to additionally set up the necessary ETL or ELT processes. While the latter is a fairly technical process that I don't want to dive into in detail here, the main thing to understand is this: if you chose the right architecture at the previous stage, this shouldn't cause any real difficulties.
And the most important part of this stage isn't just setting up data collection — it's ensuring its accuracy and cleanliness through periodic data quality checks.
Data Processing and Visualization
The final step of the technical part of your marketing analytics is data processing and visualization.
Data processing is definitely no less important than visualization, but since it happens "behind the scenes," so to speak, and very rarely affects the end user's experience, I'll focus on the latter.
Good data visualization matters. But even the most beautifully designed report has no value if, after looking at it, the main question that remains is: "So what?" A report shouldn't just be a collection of charts — it should be an answer to a specific business question. It needs to surface the problem and give you an understanding of what actions need to be taken.
In other words, a good report should consistently walk you through the following questions:
- What happened?
- Why did it happen?
- What should we do about it?
Many dashboards end up unused precisely because they stop at describing the situation, without offering any answers about what to do next.
To build a report like that, an analyst has to have a very clear understanding of which questions it needs to answer — otherwise, it just becomes an exercise in arranging pretty charts. But if you've followed this path according to my plan, step by step, you'll be in good shape.
Instead of a Conclusion
Although this piece is coming to an end, it's really only the beginning: yes, the analytics system has been built, but analytics doesn't deliver a return on investment for the business until it's actually used to make management decisions. Remember: the job of analytics isn't just to show numbers — it's to help you make decisions and drive action.
Comments
Share your thoughts and ask a question
Loading comments...